Your one-stop shop for JUCE modules, tools, assets and resources

End-to-end tests and debugging for live JUCE WebView UIs (WKWebView/WebView2): click and fill the DOM, eval JS, inspect console/network, check native C++ state, capture WebGL/canvas screenshots. Also drivable by AI coding agents. Debug-only JUCE module + zero-dependency Node clients; no CDP.


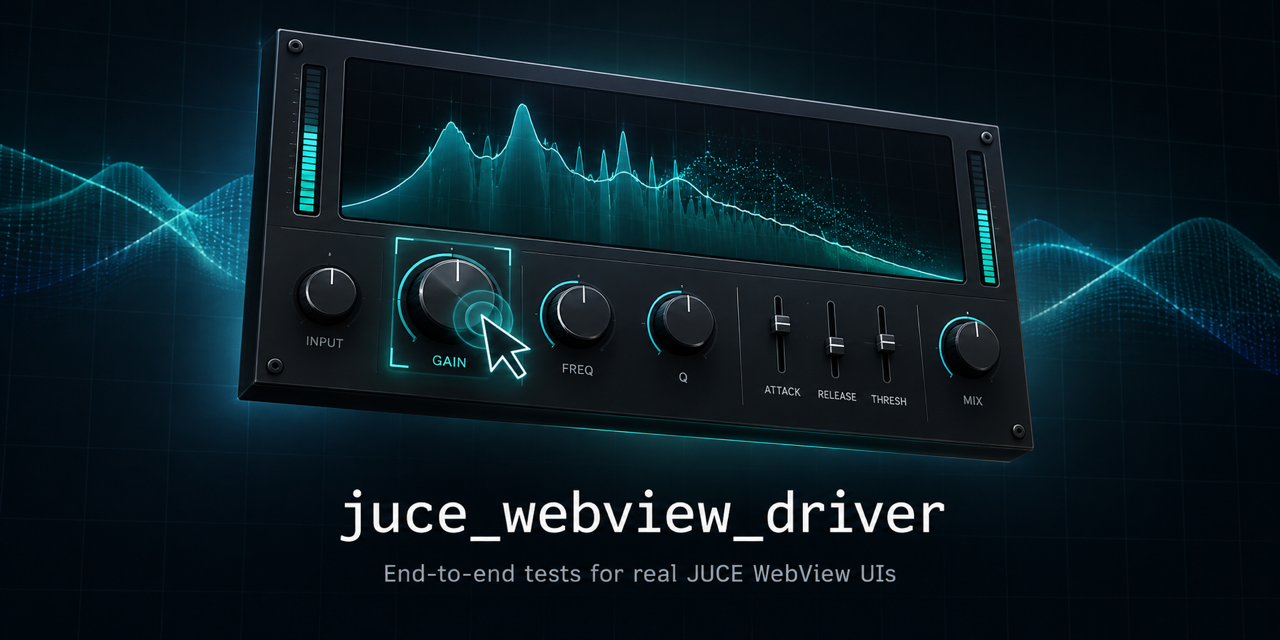
End-to-end tests and debugging for the real WebView UI of a running JUCE plugin or app.
A JUCE WebView frontend is usually tested in a separate browser, against a mocked
backend. That copy has none of the plugin's real state, timing or native rendering,
so the bugs that matter (a control that doesn't reach the C++ parameter, a preset
that loads wrong, a WebGL view that draws nothing) never show up there.
juce_webview_driver is a debug-only JUCE module plus a zero-dependency Node
client that drives the live juce::WebBrowserComponent inside your running plugin,
so a test can do this:
import { connect, expect } from 'juce-webview-driver';

const page = await connect();
await page.getByTestId('gain').fill(0.25);                    // the real UI
await expect.poll(() => page.backend('getGain')).toBe(0.25);  // the real C++ state
await page.getByTestId('meter').screenshot();                 // the real pixels, WebGL included
What you get on the live WebView:
expect, accessibility snapshots;withNativeFunction functions with page.backend(...)
and assert on what the plugin actually did;console.*, uncaught errors, and network (fetch/XHR,
WebSocket, SSE, sendBeacon, resource timing) streamed live, plus eval of
any JavaScript.It works the same on WKWebView (macOS) and WebView2 (Windows), with no
Chrome DevTools Protocol and no remote-debugging flag: everything rides on JUCE's
own evaluateJavascript and native functions.
The same client also makes the running UI usable by AI coding agents: a skill teaches an agent to inspect and drive it while it debugs.
⚠️ Security. The bridge evaluates arbitrary JS. Access is gated only by the loopback (
127.0.0.1) bind plus a per-session token — and the token sits in plaintext in the discovery file, so loopback is the real trust boundary (there is no TLS; anything that can reach localhost + read your home dir is trusted). It is gated toJUCE_DEBUGby default (WEBVIEW_DRIVER_ENABLED). Never ship it enabled in a release build.
examples/demo-plugin is a minimal JUCE 9 plugin with a
WebView UI and a test that moves its slider, checks the parameter in C++, and
takes a native screenshot of a WebGL meter. Build it, start it, run the test —
no changes to your own project needed.
This started in Better Message Mycelia, a JUCE app with a dense React + PixiJS/WebGL plugin UI. A browser copy could not reproduce native state or timing, WKWebView had no CDP, and in-page screenshots missed GPU content. Driving the running plugin instead made it possible to:
On Windows, Playwright can attach to WebView2, but only through a CDP endpoint you
have to enable with a remote-debugging flag. On macOS, WKWebView exposes no CDP at
all, so Playwright cannot attach. This driver gives you one API on both, and adds
what a browser tool can't see: your plugin's C++ state through backend(), and
compositor screenshots that include WebGL.
It is not a Playwright replacement: input is synthetic, network is observe-only,
and there is one page. You can still use the @playwright/test runner as a harness;
see examples/playwright-test.
Honest test coverage, so you know what you're getting:
| Area | macOS (WKWebView) | Windows (WebView2) | Linux |
|---|---|---|---|
| eval / console / network / DOM / e2e | ✅ used daily against a real plugin | ✅ verified against a real WebView2 Debug standalone | ⚠️ untested against a real app |
Native screenshot (shot) | ✅ (macOS 14+, ScreenCaptureKit) | ✅ (Windows 11, Windows.Graphics.Capture + D3D11) | ❌ TODO |
| C++ + JS test suites | ✅ CI | ✅ CI | ✅ CI |
| Demo plugin | ✅ builds and passes its test | ✅ builds in CI | ✅ builds in CI |
The Windows real-app verification covers discovery/auth, Unicode eval, console and fetch capture, DOM locators, React-safe fill/click, accessibility snapshots, large chunked reads, sink replay, and native full-window/region screenshots. WebKit layer inspection remains macOS-only. Linux real-app reports and fixes are very welcome.
Requirements: JUCE 8 or 9, C++17, a juce::WebBrowserComponent-based UI; the
clients need Node ≥ 22 (zero runtime dependencies).
It's a standard JUCE module. Get the repo — as a submodule:
git submodule add https://github.com/mateusz28011/juce-webview-driver.git modules/juce-webview-driver
or with CMake FetchContent (after JUCE has been added, so
juce_add_module is available):
include(FetchContent)
FetchContent_Declare(juce_webview_driver
    GIT_REPOSITORY https://github.com/mateusz28011/juce-webview-driver.git
    GIT_TAG        v0.8.1)
FetchContent_MakeAvailable(juce_webview_driver)
The module itself lives in the juce_webview_driver/ subdirectory (JUCE requires the
module directory to be named exactly like the module ID). Register and link it:
# Submodule/manual checkout:
juce_add_module(path/to/juce-webview-driver/juce_webview_driver)

# FetchContent_MakeAvailable registers the module through the repo's root CMakeLists.
target_link_libraries(MyPlugin PRIVATE juce_webview_driver)
Install the zero-runtime-dependency Node client separately in the project that owns your e2e tests. The npm package is independent of how the C++ module was fetched and includes strict TypeScript declarations:
npm install --save-dev juce-webview-driver
npx juce-webview-driver ping
#include <juce_webview_driver/juce_webview_driver.h>

// 1. Fold capture into the WebView Options (before creating the WebView):
auto bridge = std::make_shared<webview_driver::WebViewDriver>();
options = webview_driver::withCapture (std::move (options), bridge);   // no-op if disabled

// 2. After the WebView exists, wire eval + bounds and start listening:
webview_driver::connect (*bridge, *webView, *this /* component for screen bounds */);
bridge->start();                                                  // 127.0.0.1:8930

// 3. On teardown, before the WebView is destroyed:
bridge->stop();
Wrap the calls in #if WEBVIEW_DRIVER_ENABLED if you keep the bridge member
unconditionally (a std::shared_ptr to a forward-declared type is fine).
skills/juce-webview-driver/ is a skill that teaches a coding agent
(e.g. Claude Code) to drive the bridge — commands, the e2e client, diagnostic
techniques, and the gotchas below in agent-digestible form:
npx skills add mateusz28011/juce-webview-driver
With the npm package installed, use npx juce-webview-driver. A checkout can run the committed
tools/webview-driver.mjs build directly without installing dependencies:
npx juce-webview-driver ping
npx juce-webview-driver eval "document.title"
npx juce-webview-driver logs                     # live console + network stream
npx juce-webview-driver shot /tmp/ui.png         # native compositor shot of the host window
npx juce-webview-driver shot /tmp/panel.png "#panel"  # crop to an element
Other commands: hello, dom, click, fill, capture, backlog,
layerdebug, layertree, and instances (list running bridges without
connecting). Port and token are normally auto-discovered.
The package root exports a Playwright-shaped client with client-side auto-waiting:
import { connect, expect } from 'juce-webview-driver';

const page = await connect({ activate: 'My App' });
await page.getByTestId('patch-name').fill('warm pad', { enter: true });
await page.locator('text=Save').click();
await expect(page.locator('.patch-row')).toHaveCount(1);
await expect.poll(() => page.backend('getPatchCount')).toBe(1);
page.close();
The client includes CSS/text/role locators, click/fill/type/drag actions, auto-retrying assertions, accessibility snapshots, native screenshots, live console/network/error events, large-value reads, render-performance probes and JUCE native calls. Full API and operational guidance: docs/e2e.md.
On start() the host binds 127.0.0.1:8930 (scanning upward on collision) and
publishes {port, token} to ~/.juce_webview_driver.json (plus a per-instance file
under ~/.juce_webview_driver.d/ so several hosts coexist). Clients read it
automatically; a random per-session token gates every connection. The wire is
newline-delimited JSON over TCP (hello / ping / auth / eval / eval_big / bounds /
shot / shot_stream / layerdebug / layertree / sink_replay + the unsolicited sink event stream) — the full op table,
sink-frame format, and discovery details are in docs/protocol.md.
shot_stream (frame-rate capture) is macOS 14+ only — it needs a
persistent SCStream, which the Windows/Linux screenshot backends don't have.
On other platforms it isn't advertised in hello.ops and replies
SCREENSHOT_UNAVAILABLE.shot/shot_stream write to client-supplied paths. The authenticated
client can write PNGs anywhere the host process can write — loopback + token
is the trust boundary, not the path.isTrusted === false, so APIs gated
behind a user gesture (file pickers, some clipboard/fullscreen) are out of reach.null result — rely on the console/error stream there.Both suites live in tests/ and run independently of any host app, so they
keep working after this module is extracted into its own repo.
# JS client — zero dependencies, Node >= 22
npm test                     # or: node --test tests/*.test.mjs

# Maintainer build — strict TypeScript source -> committed .mjs + .d.mts
npm ci --ignore-scripts
npm run build
npm run test:types

# C++ bridge — fetches JUCE + Catch2 on first configure
cmake -S tests -B build/test
cmake --build build/test
ctest --test-dir build/test --output-on-failure

# reuse a local JUCE checkout instead of downloading it:
cmake -S tests -B build/test -DWVD_JUCE_DIR=/path/to/JUCE
The JS tests drive the real clients against a mock bridge; the C++ suite drives the real loopback server. Neither requires a host app.
See CONTRIBUTING.md — ground rules (app-agnostic, zero client deps, debug-only), how to run both test suites, and the release flow. Linux capture support and Linux real-app verification are the most wanted contributions.
MIT — see LICENSE.
Something wrong with this product?
ReportAre you the owner of this product?
Request Ownership